
Briefings / Infrastructure
What Freight Statistics Tell a Region
Tonnes, tonne-kilometres and terminal handling describe different activities. Clear definitions help regional readers interpret changing freight totals.
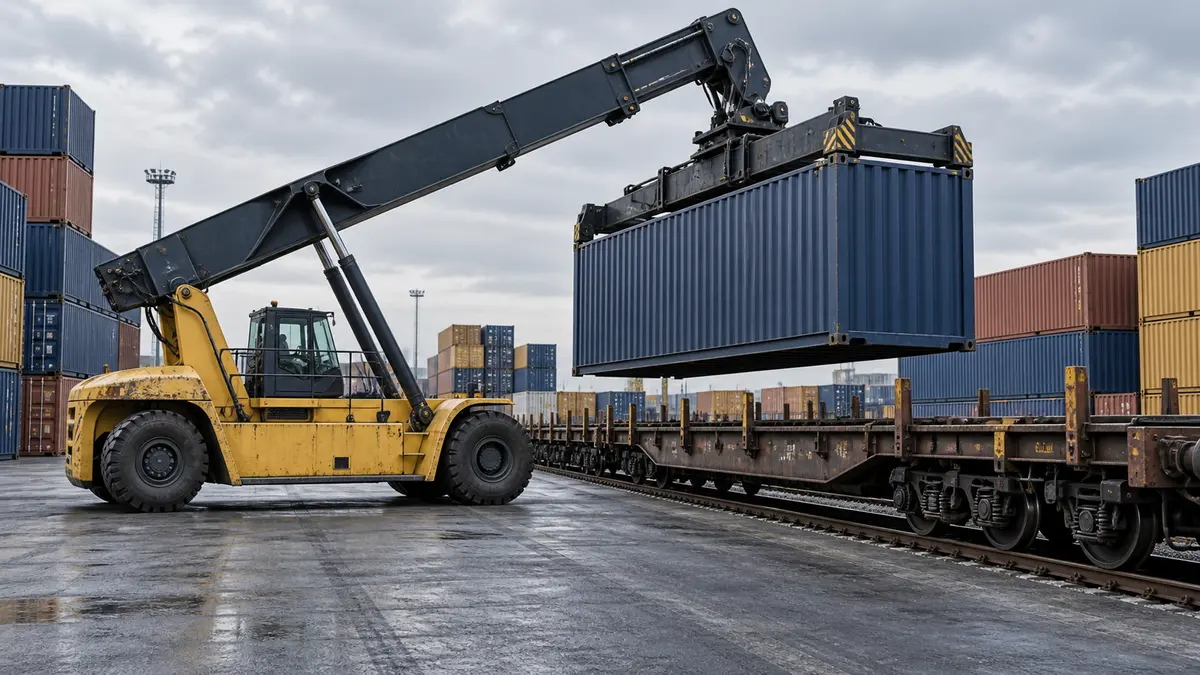
A regional freight headline can appear straightforward: more cargo moved, fewer goods were loaded, or transport activity increased. Yet these statements may refer to different events, organisations and units. Before using the number to explain local business conditions, establish what has been counted. A change in the mass of goods is different from a change in the distance over which those goods travel, and neither directly measures the income earned along the journey.
The Bank of Russia's March 2026 Regional Economy report makes this distinction in its discussion of 2025 freight activity in Russia. Its rail analysis connects different movements in freight tonnage and freight turnover with changes in average haul distance. The following explanation uses original hypothetical examples to show how such measures can inform a regional discussion without being mistaken for interchangeable evidence.
Start with the event behind the total
A statistical series needs more than a short title. Identify whether it records goods accepted for transport, goods carried over a defined network, cargo handled at a terminal or another specified event. Then identify the reporting population. A total supplied by particular operators does not necessarily cover every movement through the same geographical area. These boundaries determine which questions the number can answer.
For a local business reader, the distinction can be practical. A manufacturer wants to understand dispatches from its area. A terminal operator wants to understand handling activity. A regional analyst may want to describe flows into and out of the territory. Each can use freight data, but one common headline cannot substitute for the different definitions. Begin the explanation with the event and population rather than attaching them as an afterthought.
A minimum description for a freight figure
- The event counted and its unit of measurement.
- The operators, facilities or transport network covered.
- The geographical rule used to assign the activity.
- The period and the comparison period.
- The treatment of transfers, repeated handling and revisions.
- The source and whether the figure is provisional or final.
Not every publication will provide all these details in its opening paragraph. Follow the methodology or explanatory notes when an interpretation depends on them. If a boundary remains unknown, keep the conclusion correspondingly narrow. A missing definition is not permission to choose the interpretation that makes the most striking story.
Tonnes and tonne-kilometres answer different questions
Tonnes describe mass. Tonne-kilometres combine mass with the distance carried over the movements included in the calculation. For one movement, multiplying the tonnes carried by its distance gives transport work in tonne-kilometres. For a collection of movements, calculate that product for each and add the results. The resulting total describes transport work under the chosen coverage, rather than the value of the goods or the carrier's earnings.
Consider a deliberately simplified fictional comparison. In the first period, 100 tonnes travel 100 kilometres, producing 10,000 tonne-kilometres. In the second, 80 tonnes travel 200 kilometres, producing 16,000 tonne-kilometres. The mass carried falls by 20%, while transport work rises by 60%. Both observations are correct. The different directions follow from the greater distance, not from an error that requires one measure to be discarded.
This example contains no assumption about prices, delivery time or vehicle utilisation. It cannot establish that the carrier earns more, that customers receive a better service or that a region produces more goods. Those conclusions would require additional evidence. The calculation is useful because it identifies precisely what changed and leaves the other questions open for investigation.

Calculate average haul with the appropriate weights
An average distance should reflect the quantity represented by each movement when it is being used to connect tonnage with tonne-kilometres. Within a consistent dataset, divide total tonne-kilometres by total tonnes to obtain a mass-weighted average haul. A simple average of route lengths answers a different question because it gives a lightly used route the same weight as a heavily used one.
For another fictional example, suppose 90 tonnes travel 100 kilometres and 10 tonnes travel 500 kilometres. Their transport work is 9,000 plus 5,000, or 14,000 tonne-kilometres. Dividing by the combined 100 tonnes gives an average haul of 140 kilometres. The unweighted average of the two distances is 300 kilometres. It describes the two route lengths equally, not the distance associated with the average tonne in this set.
Use that relationship only when the numerator and denominator cover the same movements. A national tonne-kilometre figure divided by tonnage from selected regional operators does not create a meaningful average merely because the units cancel. Coverage, reporting periods and treatment of movements must align as well. Published averages may also use definitions that need checking before they are reconstructed from a headline table.
Recognise what happens when goods change hands
The same physical goods can appear in several activity records without any of those records being wrong. A consignment may be carried to a terminal, handled there and then transported onward. The first carrier, the terminal and the second carrier each perform a service. Their records describe those services; adding the mass across all three does not automatically produce the quantity of distinct goods supplied to the final customer.
Imagine ten tonnes moving by road to a rail terminal and then continuing by rail. Both transport legs can record ten tonnes under their respective definitions. A terminal may also record relevant handling according to its own rules. The original consignment still contains ten tonnes. An aggregate of activity across legs can be valid if that is the intended measure, but it should not be labelled as unique cargo without a method that removes repeated counting.
Do not assume that every terminal counts loading and unloading in the same way. Read the relevant definition, including the treatment of transshipment and domestic movements. A port-handling series and a shipping-company series may differ because they cover different operations and populations. Their divergence should prompt a comparison of definitions before it is treated as evidence that one source is unreliable.
Choose the geography that matches the question
Freight can be assigned to a region in several ways: where the goods originate, where they are delivered, where a facility handles them, or where the reporting operator is based. These perspectives overlap, but they are not identical. A local operator may carry goods elsewhere, while a local terminal may serve cargo originating far beyond the region. State the geographical rule alongside the figure.
Transit is particularly easy to misinterpret. Goods passing through a territory may support handling or transport services without representing goods produced there. Conversely, a local manufacturer may dispatch through a terminal in another region. A change in terminal activity therefore cannot by itself establish an equivalent change in local manufacturing output. The connection needs evidence about origins, destinations and the businesses involved.
Maps can help explain these differences if their purpose is explicit. A map of facilities shows where infrastructure is located; a flow map describes movements; a map of operator registrations describes business addresses. Avoid presenting one as though it were another. For a regional briefing, a short explanation of coverage may be more useful than a detailed map whose underlying assignment rule is unclear.
Look inside the commodity mix
A freight total combines goods with different physical and commercial characteristics. A change in a heavy bulk commodity can dominate tonnage even while other activities expand. This is an arithmetic feature of an aggregate, not a reason to dismiss it. The response is to examine the relevant breakdown and explain which categories account for the movement in the total.
A fictional terminal illustrates the point. In one period it handles 900 tonnes of one bulk category and 100 tonnes of other goods. In the next, the bulk category falls to 800 tonnes while the other goods rise to 150. Total handling declines from 1,000 to 950 tonnes, a 5% decrease. At the same time, the smaller category grows by 50%. Saying only that freight fell conceals an important difference within the operation.
Neither category's percentage change reveals its contribution to revenue, employment or value added. The smaller tonnage category may require different handling, but that must be established rather than assumed. Keep the mass comparison separate from claims about the economic importance of the goods. Where a business question concerns a particular commodity, use its series rather than expecting the aggregate to provide a precise answer.
Do not convert containers into cargo mass by assumption
Container counts introduce another unit. A count of physical containers is not necessarily the same as a count expressed in twenty-foot equivalent units, usually abbreviated TEU. Under that size convention, a forty-foot container represents two TEU, but it does not automatically contain twice the cargo mass of a twenty-foot container. Establish which unit the publication uses before comparing its total with another table.
Empty equipment also matters. A series may include empty containers, loaded containers or both. More container movements can therefore reflect repositioning as well as the movement of goods. If the question concerns cargo supplied to local businesses, inspect the loaded-container coverage and any available mass data. If the question concerns terminal equipment handling, empty movements may be relevant in their own right. Neither interpretation should be silently imposed on an unspecified total.
Keep the container measure in its original unit unless there is a supported conversion for the relevant population. An assumed average weight applied to every container can create an apparently precise tonnage estimate while concealing differences in size, loading and commodity mix. If an estimate is necessary, label it as an estimate, disclose the conversion basis and keep it separate from directly reported mass. The same discipline applies when a chart places vehicle counts beside cargo tonnes: the two series can be informative together without being equivalent.
Keep the reporting period visible
The publication date tells the reader when information became available, not necessarily when the measured activity occurred. A report released in March may review the preceding calendar year and also discuss more recent business observations. Preserve those time frames in the text. Moving an annual figure into a sentence about current conditions can make historical evidence appear more immediate than it is.
Comparison periods also matter. A monthly change, a year-on-year change for one month and a cumulative change since January describe different intervals. Do not place their percentages beside one another as if they were competing estimates of the same event. Specify the start and end of each interval and whether seasonal adjustment has been applied when the source provides that distinction.
When a series is revised, compare like versions where possible. A newly revised previous-year total can change the calculated growth rate even if the current-year figure stays the same. Preserve the release date used for a historical analysis and make later updates explicit. A regional dashboard should not silently combine the latest numerator with an obsolete comparison value when a consistent revised pair is available.
Separate measured activity from business explanations
Statistics establish a measured change within their definitions. Interviews and surveys can help explain how businesses experienced that change. They are complementary forms of evidence, but they should retain their identities. An operator's account of a difficult period does not become a network-wide measurement, and a network total does not show that every individual operator had the same experience.
Attribute explanations at the level the evidence supports. If several businesses report that a change in delivery patterns affected them, say so without converting their experience into a universal cause. If the data show longer average hauls, investigate the composition of movements before deciding why they lengthened. A shift between routes, commodities or customers can alter an average without every shipment travelling farther.
Be equally careful with forecasts. Expected freight growth, a capacity announcement and realised activity occupy different stages. They can appear in the same briefing, but their labels must remain distinct. A planned facility may be relevant to future flows while contributing nothing to the current reporting period. Including its proposed capacity in the present activity total would change the meaning of the measure.
Connect freight evidence with local questions
Regional readers may ultimately care about jobs, business access, congestion or investment. Freight measures can help frame those questions, but they rarely answer them alone. For employment, seek information on the relevant workforce and activities. For congestion, examine movements at particular places and times. For service access, investigate which users and destinations can actually be served.
A larger tonne-kilometre total does not locate the additional transport work within a particular town. A larger terminal total does not reveal whether activity is concentrated in a short peak or distributed across the day. Those distinctions matter when deciding what further evidence to collect. The useful next step is a focused question about the local relationship, not an unsupported conversion from freight growth to a broad economic outcome.
For an investment discussion, distinguish the evidence describing existing use from assumptions about future use. Explain the traffic population, period and operational boundary behind the baseline. Then show separately any proposed changes and their basis. This keeps an observed statistic from lending unwarranted certainty to a forecast simply because both appear in the same presentation.
Build a small dashboard with stable definitions
A useful regional dashboard can begin with a few consistently defined measures rather than a long collection of loosely related totals. Show mass carried or handled, transport work where available, the corresponding coverage and a relevant commodity or geographical breakdown. Attach the source, period and release version to each series so that another reader can follow the comparison.
Explain relationships between the measures instead of forcing them to move together. If tonnes fall while tonne-kilometres rise, examine distance and composition. If terminal handling grows while local production is unchanged, investigate transit and routing. A divergence is often the beginning of the analysis. It does not automatically identify an error, a contradiction or a success that one headline can settle.
The central discipline is to match the conclusion to the measurement. A well-defined freight figure can describe a meaningful part of regional activity without standing in for the whole economy. Keeping mass, distance, handling and geography distinct gives readers a clearer picture of what is known, what has changed and which additional questions deserve attention.
Leave a comment